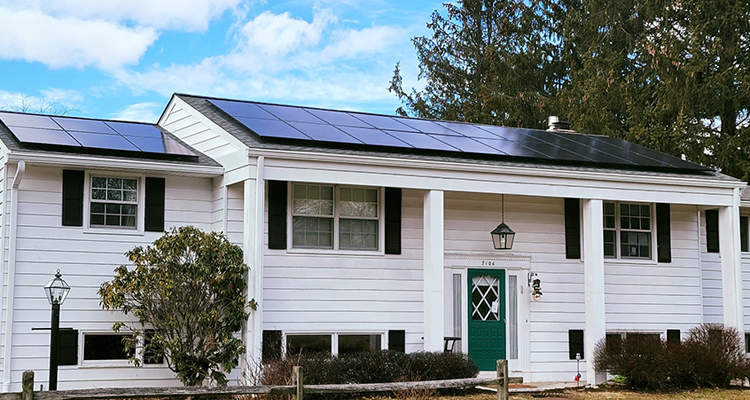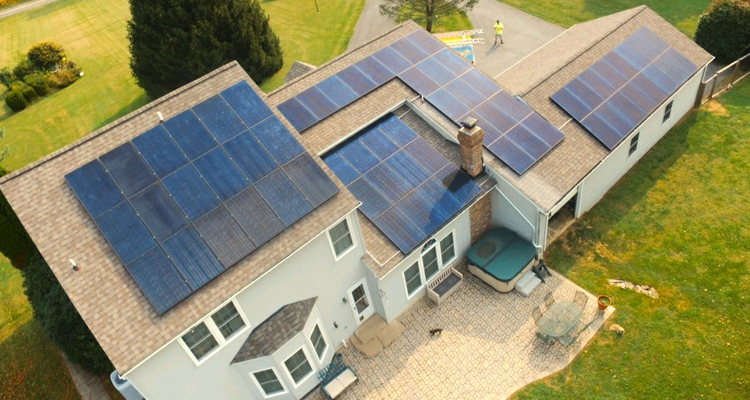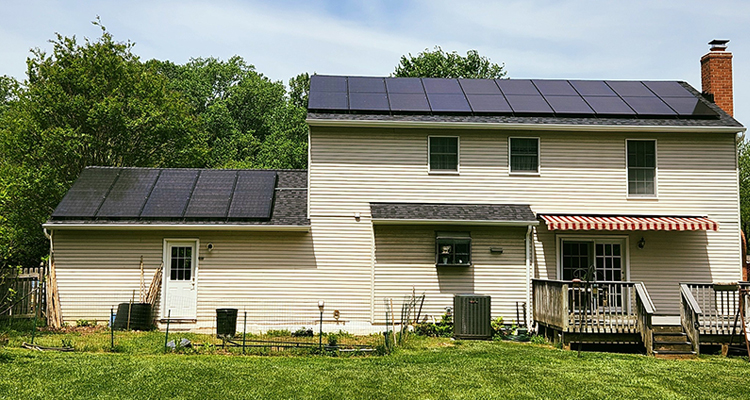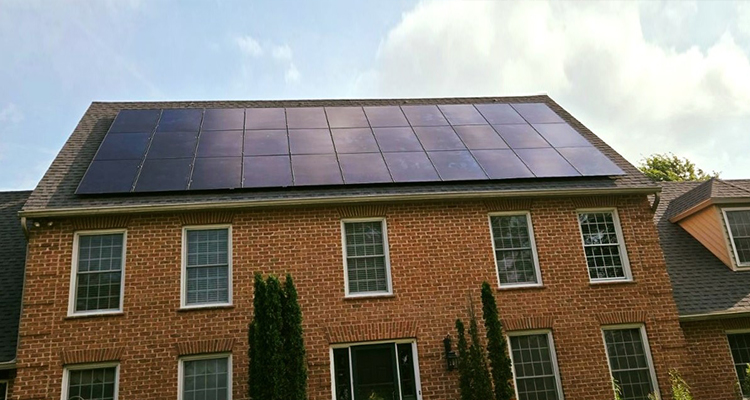


Solar electric is a smart, easy and affordable choice for your energy production needs.
MSSI makes it simple for you to design and have a system installed which will produce up to 100% of your energy needs for the next 25 years.
Imagine, watching your meter run backwards and the utility co. crediting you because you have become an energy producer – not a "user".
On your rooftop, your shed, your porch, and your carport or to maybe convert your boat... for your business, residence, your summer home or your winter chalet, our solar electric systems will help you have an immediate and critical positive effect on the earth.
Did you know? The average home with a solar panel installation will save about 7 tons of CO2 emissions each year! Contact us today for an estimate on solar panel installations in MD.
All residential homeowners and commercial businesses in Maryland are eligible for tens of thousands of dollars in direct State and Federal tax credits for homes, offices or businesses. Your solar energy production transition is a practical choice in today's "inflation minded" economy.

Hi all... We are very pleased and happily satisfied with the service, professionalism, courtesy, and timely work that has been done by Maryland Solar Solutions, Inc (MSSI). We would recommend to anyone contemplating solar panels to go directly to MSSI. If anyone has any concerns, questions, or ambiguities in preparation for installment of solar panels, you will get honest and transparent answers from MSSI. We highly recommend them for their job that goes beyond the call of duty.

Maryland Solar Solutions provides solar panel installations in MD as well as Solar Panel Removal, Solar Panel Repairs, Solar Array Removal & Repairs for residential homes and commercial businesses throughout the state including Baltimore City MD Solar Panels, Baltimore County Solar Panels, Harford County Solar Panels, Howard County Solar Panels, Anne Arundel County Solar Panels, Carroll County Solar Panels, Frederick County Solar Panels, Montgomery County Solar Panels, Prince Georges County Solar Panels, Cecil County MD, Queen Annes County & Talbot County on the Eastern Shore of MD, St. Mary's, Calvert &, Charles County in Southern Maryland, Washington County in Western MD and more. Before you fill out a form on EnergySage or Home Advisor and get bombarded with contractors, call us so we can explain the value of owning solar panels vs leasing. If you are looking for solar power companies or solar energy companies in Maryland please call or email for details or to find out if our experienced solar installers can install in your area.